In the Overview section, you will get a report on the analyzed website that includes the following parameters: organic and paid traffic, keywords, referring domains, backlinks, Domain Trust, and Page Trust metrics.
In the same section, you can access the traffic distribution by country, continent, and globally, as well as see where the most traffic comes from.
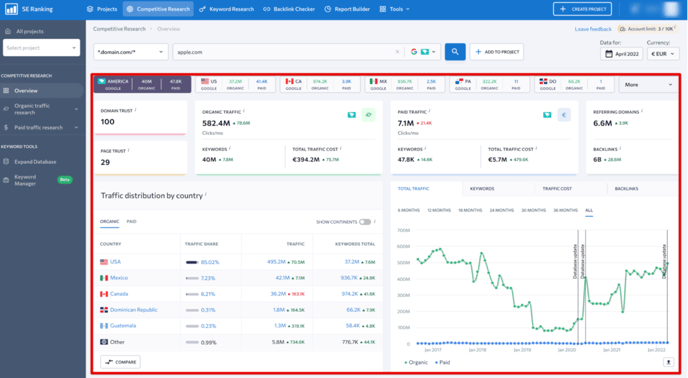
You will also be able to see how many keywords the analyzed website targets in organic and paid search in all available databases while analyzing any domain in a specific country. This will help you evaluate the promotional efforts if the domain is pushing beyond a single country environment and measure how many keywords are being promoted in other countries.
As you scroll down, you will see tables and graphs that will help you analyze keywords, competitors, top pages and subdomains in organic search:
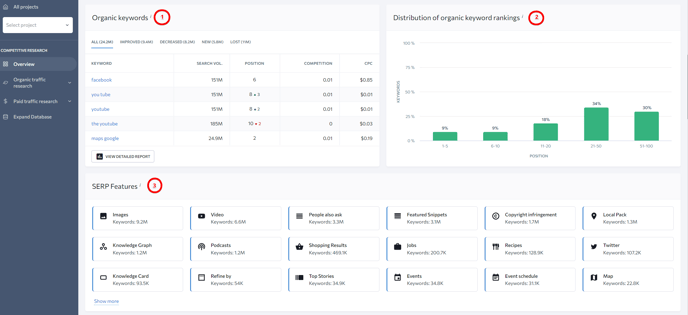
- The “Organic keywords” table contains a list of keywords the analyzed website ranks for in organic SERPs along with their search volume, ranking position, level of Google Ads competition, and cost per click. Plus, they can be sorted by All, Improved, Decreased, New, and Lost.
- The “Distribution of organic keyword rankings” chart shows the analyzed website’s organic keyword ratings based on their SERP rankings.
- The "SERP features" block shows Google's SERP features the analyzed website appears in.
- The “Organic competitors” list shows the top 5 competitor that target the same or similar keywords as the analyzed website to drive traffic from organic search.
- The “Organic competitor semantics comparison” diagram shows keyword overlaps between your and your top competitors’ domains.
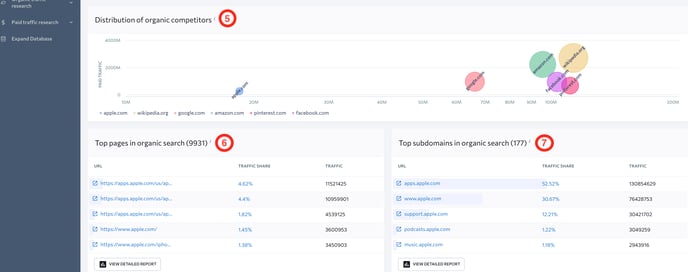
- The “Distribution of organic competitors” chart shows competing domains in the form of circles arranged according to the ratio of their traffic volume and the number of keywords they target in search. The larger the circle, the more search queries and traffic the website receives. When you hover over a circle, the tool displays the number of keywords in the selected country as well as the monthly traffic volume. The circles may also intersect, letting you know that the given domains have keywords in common with the analyzed website.
- In the list of “Top pages in organic search”, you will see which pages drive most organic traffic from Google, as well as their overall traffic share and estimate.
- In the list of “Top subdomains in organic search”, you will see which pages drive most organic traffic from Google, as well as their overall traffic share and estimate.
For more information on each section, click the “View detailed report” button.
Further down the page, you will see the same tables and graphs as in the “Organic traffic overview” section of the report only they provide data on paid search.
The only difference between the data provided on organic and paid search is that the latter has a section called “Most popular keyword ads”. It provides PPC campaign research data on the analyzed website along with the estimated volume of traffic, its share, number of paid ads, etc. Click “Expand Ads” to see the most popular ads of the analyzed website.
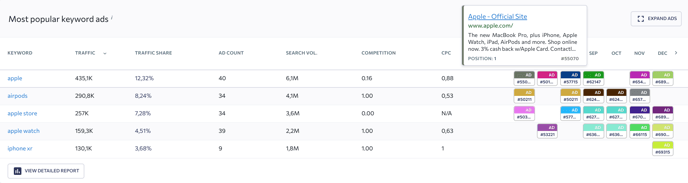
To view and copy long-tail keywords, hover over the needed keyword in the list, view it in full in the tooltip, and click on the corresponding “copy” icon.
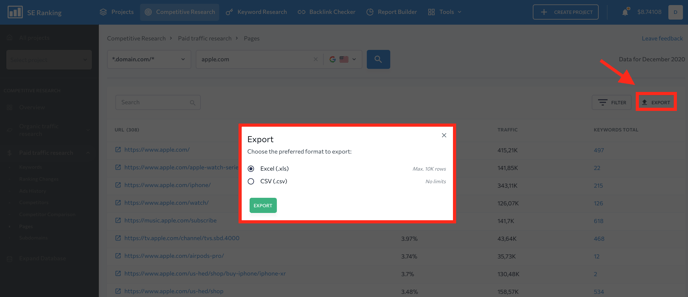
Export
With the help of the “Export” button that can be found at the top of each section, you can download a report in a .CSV or .XLS file format.
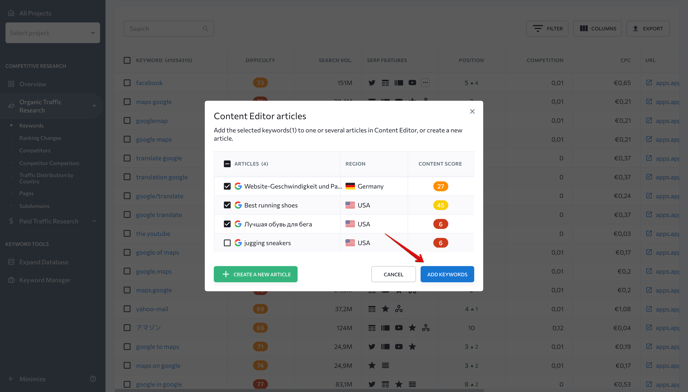
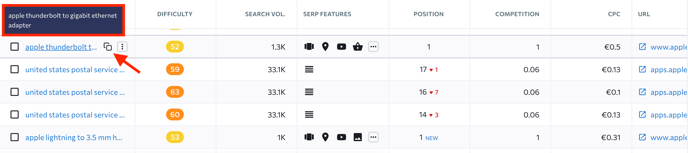
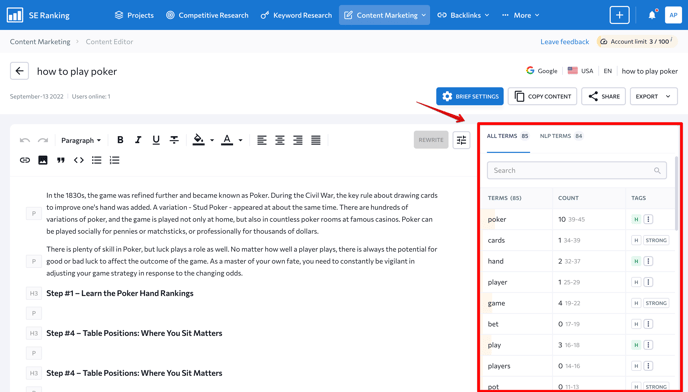
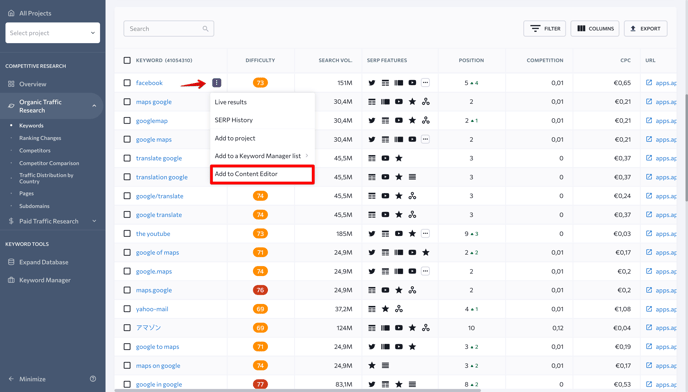
It’s possible to add keywords from the table to any of the articles in Content Editor or create a new article. The keywords will be added to the selected article’s list of terms.
Hover over the needed keyword, expand the three-dot menu, and choose “Add to Content Editor”.
Otherwise, tick several keywords, click on the “Add to” button and choose “Add to Content Editor”.
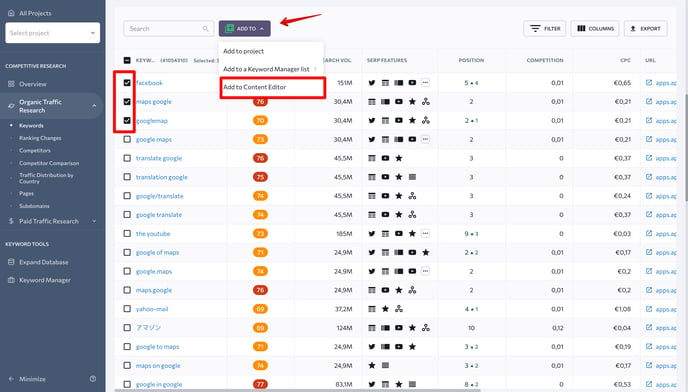
In the pop-up window, select one or several articles from the list or create a new article.