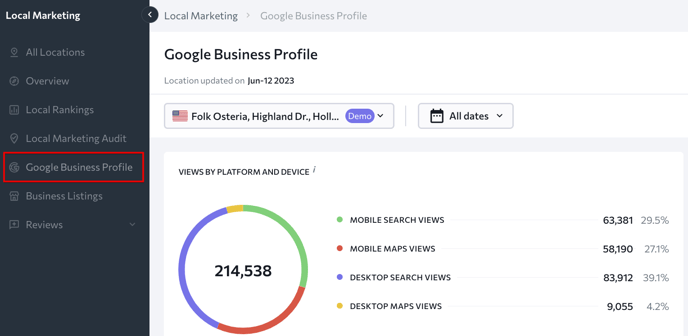
In the Google Business Profile section, you can learn how users engage with your Google Business Profile. It also shows you the type of search your visitors conduct to get to the profile. Data can be viewed over the last 7 days, the last 1/3/6/12 months, or spanning all time available.

Widgets
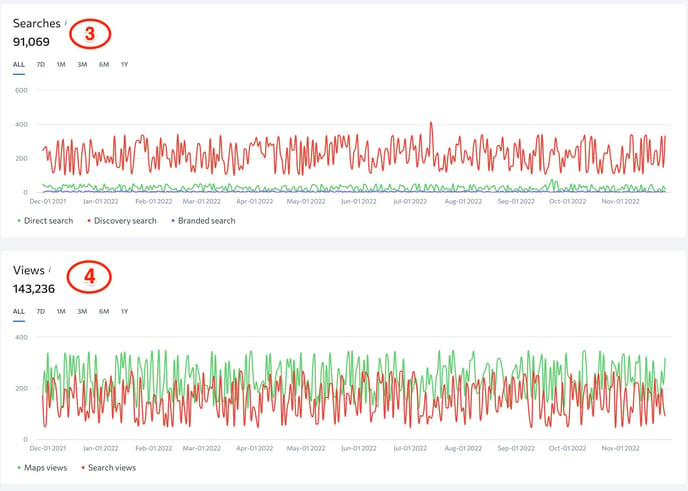
- This chart shows a comparison of different ways a customer could find this business, including direct search, discovery search, and branded search. Direct searches return results when a user directly searched for this business's name or address. Discovery searches occur when a user searches for a product or service that a company offers. Branded searches mean that a user searched for a brand related to this business.

- This chart outlines the number of times users see this business's profile on Google Maps vs. on Google Search.
- Searches. This graph shows the number of impressions this Google Business Profile gets from users in SERPs depending on the search type

4. Views. This graph demonstrates the number of times users see this business's profile on Google Maps vs. on Google Search within a specific time frame.
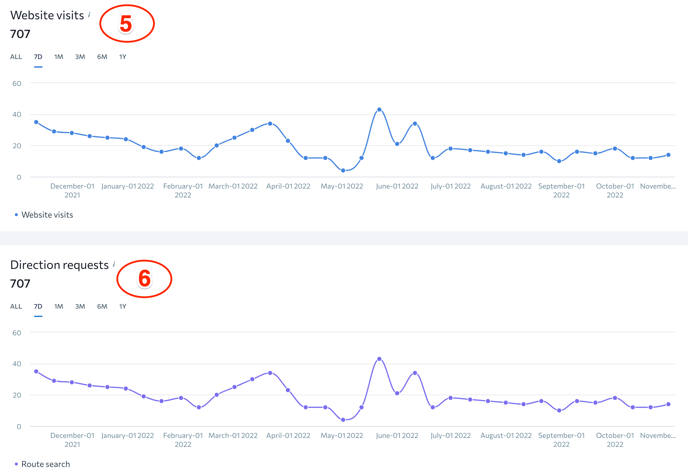
5. Website visits. This graph shows (over time) the number of times users click to open this business's website from its Google Business Profile.

6. Direction requests. The graph shows the number of times users click on this business's Google Business Profile to request directions to it (and within a specific time frame).
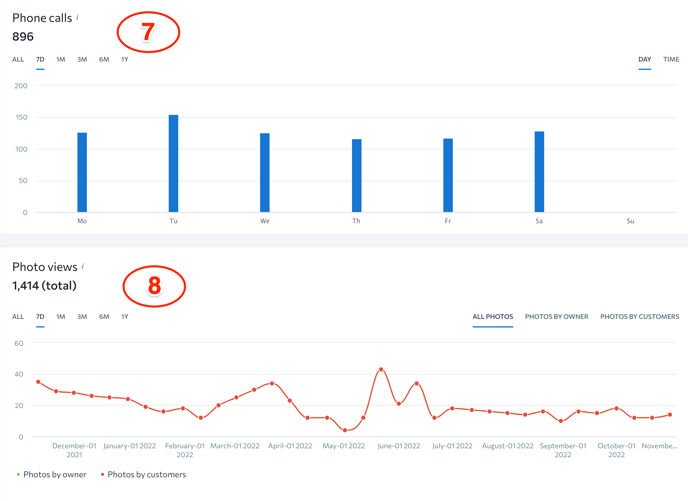
7. Phone calls. This graph outlines the number of times users click to call this business by phone from its Google Business Profile over time. When viewing data by day/time, you can identify the days and hours when most calls occur.

8. Photo views. This graph shows the number of times users view photos on this business's profile over time. All views can be filtered by photos by owner vs. photos by customers.