There are several tabs where you can find statistics for connected social accounts.
Dashboard
The Dashboard tab provides a summary of all social accounts connected to SE Ranking.
Select a period to get a summary for the specified dates. The period is set for all added pages and groups.

Facebook dashboard
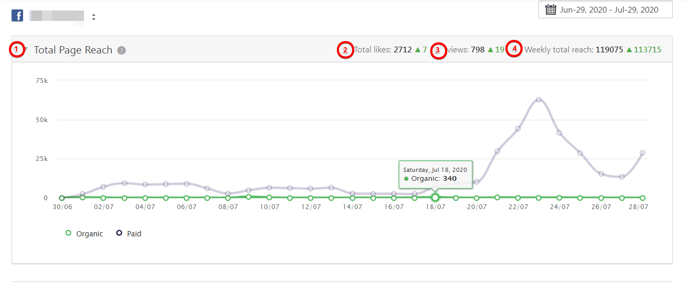
1. Total page reach The graph shows the number of users who saw you page each day during the specified period. The organic and paid reach are highlighted in different colors.
2. Total likes The number of likes for the specified period of time and their dynamics (by how much has this number increased or decreased).
3. Views The number of pageviews for the specified period of time and their dynamics (by how much has this number increased or decreased).
4. Weekly total reach The page reach for the last week and its dynamics (by how much has this number increased or decreased).
X (ex-Twitter) dashboard
Facebook metrics
The "Facebook metrics" tab presents detailed statistics about your Facebook pages.
To see data for a certain period of time, specify it in the appropriate field.
If you have several pages connected to SE Ranking, you can switch to see their metrics within the tab. Here you can also add another Facebook account.
X (ex-Twitter) metrics
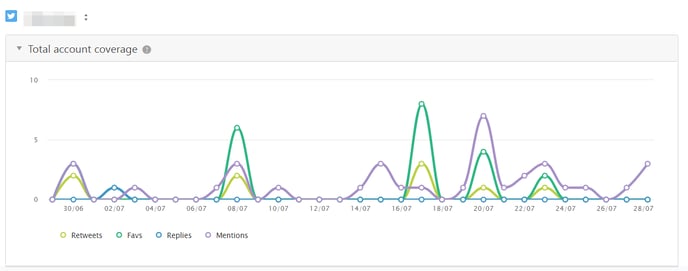
The "X (ex-Twitter) metrics" tab displays your X (ex-Twitter) account metrics, namely the numbers and dynamics:
- retweets
- favs (adding tweets to favorites)
- answers

To see data for the certain period, specify it in the appropriate field.
If you have several pages connected to SE Ranking, you can switch to their metrics within the tab. Here you can also add another X (ex-Twitter) account.